NASDAQ® | NYSE® | AMEX® | OTCBB® | Pink Sheets®
Thursday February 5, 2026
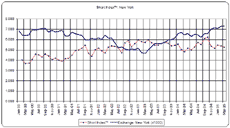
The original stock Short Index tracks the outstanding levels of short interest in the NYSE® and NASDAQ® and relates these levels vs. market performance. The Short Index™ is historically graphed side-by-side correlating market performance (1999 to the present). Easily view how current levels of short interest in the market have correlated with upcoming stock market moves! Updated and available for immediate access.


“The possibility of a short squeeze is one reason some analysts look at a high amount of short interest as a bullish indicator. Short Interest is the fuel, performance is the fuse, says ShortSqueeze.com”
- USA Today
...short sellers, not financial results, are driving up Air T's share price. More than half the shares were sold short last month, according to ShortSqueeze.com”
- Reuters
“...according to ShortSqueeze.com. Any encouraging news from Martha Stewart Living could lead to a wave of short sellers trying to buy stock and limit their losses, pushing the price higher. ”
- CNBC / MSN Money
A subscription to ShortSqueeze.com gives you access to a spreadsheet packed with data... interesting and useful...”
- Barron's